- Each internal node tests an attribute
- Each branch corresponds to attribute value (e.g., a category on
- Each leaf node (terminal node) assigns a classification
https://www.cs.cmu.edu/afs/cs/project/theo-20/www/mlbook/ch3.pdf

- What is the predicted variable
- What are the predictors (
- how would a table with the predictors and predicted value look like. Create a table with one observation for each leaf.
- Write down the decision tree as an
if-condition in Python
https://www.cs.cmu.edu/afs/cs/project/theo-20/www/mlbook/ch3.pdf

-
What is the predicted variable classified in this tree?
- Decision whether to play tennis (binary classification)
-
What are the predictors used in this tree?
- Weather outlook, Humidity, Wind
-
Example Data
| Outlook | Humidity | Wind | Play? |
|---|---|---|---|
| Sunny | High | - | No |
| Sunny | Normal | - | Yes |
| Overcast | - | - | Yes |
| Rain | - | Strong | No |
| Rain | - | Weak | Yes |
How would You implement the Wind-node in python?
if outlook == "Sunny":
    if humidity == "High"
        play = "No"
    elif humidity == "Normal"
        play = "Yes"
elif outlook = "Overcast":
    play = "Yes"
elif outlook = "Rain":
    if wind == "Strong"
        play = "No"
    elif wind == "Weak"
        play = "Yes"
Decision Trees also work with continuous features
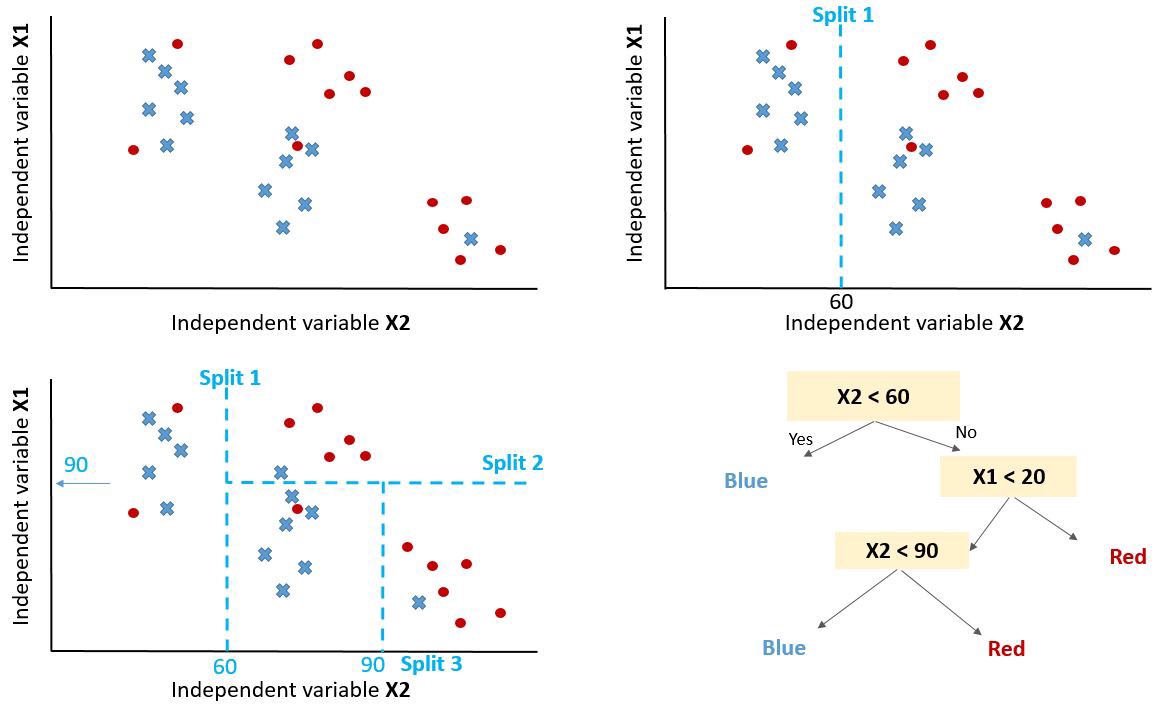
Decision Boundaries
- we want to classify the red and blue dots based on the features
- Decision boundaries split the data based on the feature values
https://towardsdatascience.com/decision-tree-models-934474910aec
 How to Build an Decision Tree from Data
- ID3 algorithm (by J. Ross Quinlan)
- top-down
- greedy approach (compare gradient descent)
- greedy heuristics just optimize the decision the next step, they often end up in local minima
1. Select the best attribute (feature in X) to split the data → A
2. Assign A as the decision attribute (test case) for the node
3. For each value (category) of A, create a new descendant of the node.
4. Sort the training examples to the appropriate descendant node leaf
5. If examples are perfectly classified, then stop else iterate over the new leaf nodes
 What is the best attribute?
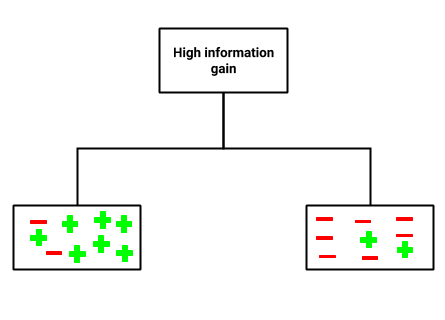
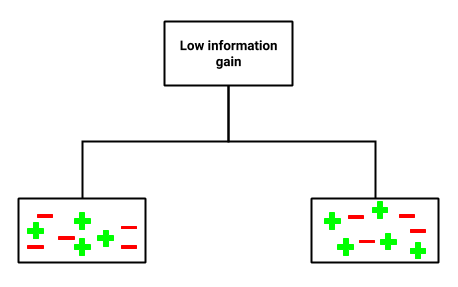
- has the most information gain
- a measure that expresses how well an attribute splits
that data into groups based on classification
- higher purity regarding the classes or less information entropy within the classes
https://www.hackerearth.com/practice/machine-learning/machine-learning-algorithms/ml-decision-tree/tutorial/
 Information Entropy
-
of a random variable is the average level of information, surprise, or uncertainty inherent to the variable's possible outcomes
-
Given a discrete random variable
Here's great explanation https://www.youtube.com/watch?v=b6VdGHSV6qg
 Example Tossing a fair Coin
- We have two possible outcomes in
-
-
-
- a fair coin toss has the maximum level of suprise
- We can use information entropy as a metric to find attribute where to split to get the highest information gain (highest purity of the classes)
-
 Example: The Data
- We want to predict whether people play based on the other features:
| Day | Weather | Temperature | Humidity | Wind | Play? |
|---|---|---|---|---|---|
| 1 | Sunny | Hot | High | Weak | No |
| 2 | Cloudy | Hot | High | Weak | Yes |
| 3 | Sunny | Mild | Normal | Strong | Yes |
| 4 | Cloudy | Mild | High | Strong | Yes |
| 5 | Rainy | Mild | High | Strong | No |
| 6 | Rainy | Cool | Normal | Strong | No |
| 7 | Rainy | Mild | High | Weak | Yes |
| 8 | Sunny | Hot | High | Strong | No |
| 9 | Cloudy | Hot | Normal | Weak | Yes |
| 10 | Rainy | Mild | High | Strong | No |
- if we split the data based on the wind data:
- Before the split
- like in the coin toss (see plot before)
- after the split in the new node with only weak winds
| Day | Weather | Temperature | Humidity | Wind | |
|---|---|---|---|---|---|
| 1 | Sunny | Hot | High | Weak | No |
| 2 | Cloudy | Hot | High | Weak | Yes |
| 7 | Rainy | Mild | High | Weak | Yes |
| 9 | Cloudy | Hot | Normal | Weak | Yes |
- after the split in the new node with only strong winds
| Day | Weather | Temperature | Humidity | Wind | Play? |
|---|---|---|---|---|---|
| 3 | Sunny | Mild | Normal | Strong | Yes |
| 4 | Cloudy | Mild | High | Strong | Yes |
| 5 | Rainy | Mild | High | Strong | No |
| 6 | Rainy | Cool | Normal | Strong | No |
| 8 | Sunny | Hot | High | Strong | No |
| 10 | Rainy | Mild | High | Strong | No |
-
-
-
- we build the average based on the number of instances in the child nodes

 Task
Task
- What is the information gain, if we split at
Weatherinstead? - to calculate
import math
math.log2(x)


| Day | Weather | Temperature | Humidity | Wind | Play? |
|---|---|---|---|---|---|
| 1 | Sunny | Hot | High | Weak | No |
| 3 | Sunny | Mild | Normal | Strong | Yes |
| 8 | Sunny | Hot | High | Strong | No |

| Day | Weather | Temperature | Humidity | Wind | Play? |
|---|---|---|---|---|---|
| 2 | Cloudy | Hot | High | Weak | Yes |
| 4 | Cloudy | Mild | High | Strong | Yes |
| 9 | Cloudy | Hot | Normal | Weak | Yes |

| Day | Weather | Temperature | Humidity | Wind | Play? |
|---|---|---|---|---|---|
| 5 | Rainy | Mild | High | Strong | No |
| 6 | Rainy | Cool | Normal | Strong | No |
| 7 | Rainy | Mild | High | Weak | Yes |
| 10 | Rainy | Mild | High | Strong | No |
-
- we achieve a higher information gain
- we have a pure node after
weather="Cloudy"
- to find a good tree, we must calculate the information gain of many possible splits
- especially, if we work with continuos features as we have to find not only the attribute but also the margin where to split the attribute (e.g.,
Over-fitting
- trees become very deep, if we continue training to reach pure leafs
- then they are likely to over-fit the data, which can be prevented in two ways
- limit the maximum depth (number of nodes)
- pruning
https://www.kaggle.com/code/dansbecker/underfitting-and-overfitting
Pruning
- removing nodes after initial training of the tree
- decreased fit on the training set
- tree is more likely to generalize on other data
- Reduced error pruning: on a validation-set replace terminal leafs by majority voting and check whether the error increases
https://www.semanticscholar.org/paper/Study-of-Various-Decision-Tree-Pruning-Methods-with-Patel-Upadhyay/025b8c109c38dc115024e97eb0ede5ea873fffdb
 Task
Task
- Draw the tree based in the following order of nodes:
- Level 1: Temperature
- Level 2: Wind
- Mark the number of decisions to play or not in the final leaves
- Which arm of the tree would you prune first?
| Day | Weather | Temperature | Humidity | Wind | Play? |
|---|---|---|---|---|---|
| 1 | Sunny | Hot | High | Weak | No |
| 2 | Cloudy | Hot | High | Weak | Yes |
| 3 | Sunny | Mild | Normal | Strong | Yes |
| 4 | Cloudy | Mild | High | Strong | Yes |
| 5 | Rainy | Mild | High | Strong | No |
| 6 | Rainy | Cool | Normal | Strong | No |
| 7 | Rainy | Mild | High | Weak | Yes |
| 8 | Sunny | Hot | High | Strong | No |
| 9 | Cloudy | Hot | Normal | Weak | Yes |
When to use trees?
- Instances describable by attribute-value pairs
- Predicted variable is discrete valued (regression is also possible)
- Possibly noisy training data
- Humans should be able to interpret decisions
- Not competitive with the best supervised learning approaches
- Advances trees like random forests and gradient boosting are very competitive
Examples:
- Equipment or medical diagnosis
- Credit risk analysis
- Modeling calendar scheduling preferences
 2.8.4 Supervised Learning: Advanced Trees
 Learning objectives
You will be able to
- perform pruning
- describe the difference between bagging and boosting
- explain the idea behind a maximal margin classifier
 Ensemble methods
- Why use one model, when You can use many?

https://quantdare.com/what-is-the-difference-between-bagging-and-boosting/

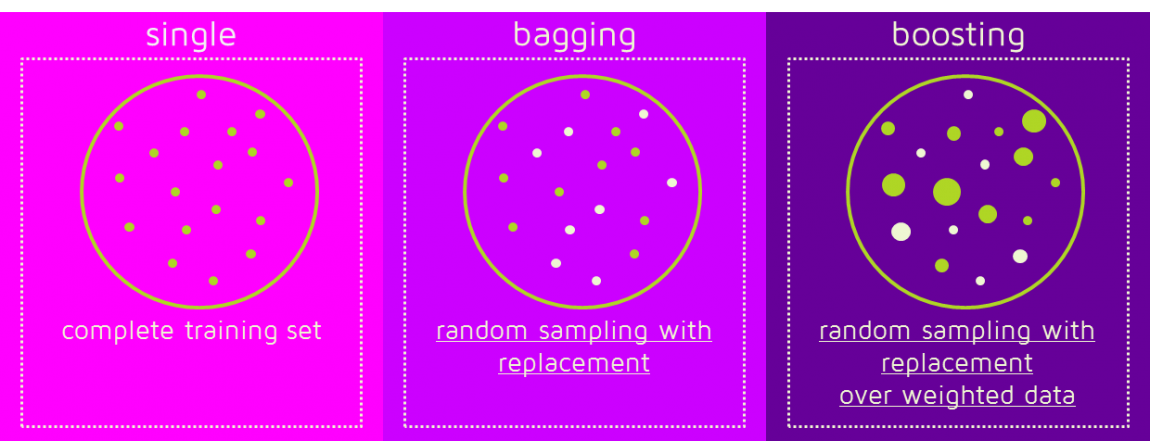
https://quantdare.com/what-is-the-difference-between-bagging-and-boosting/
 Random Sampling (Bagging)
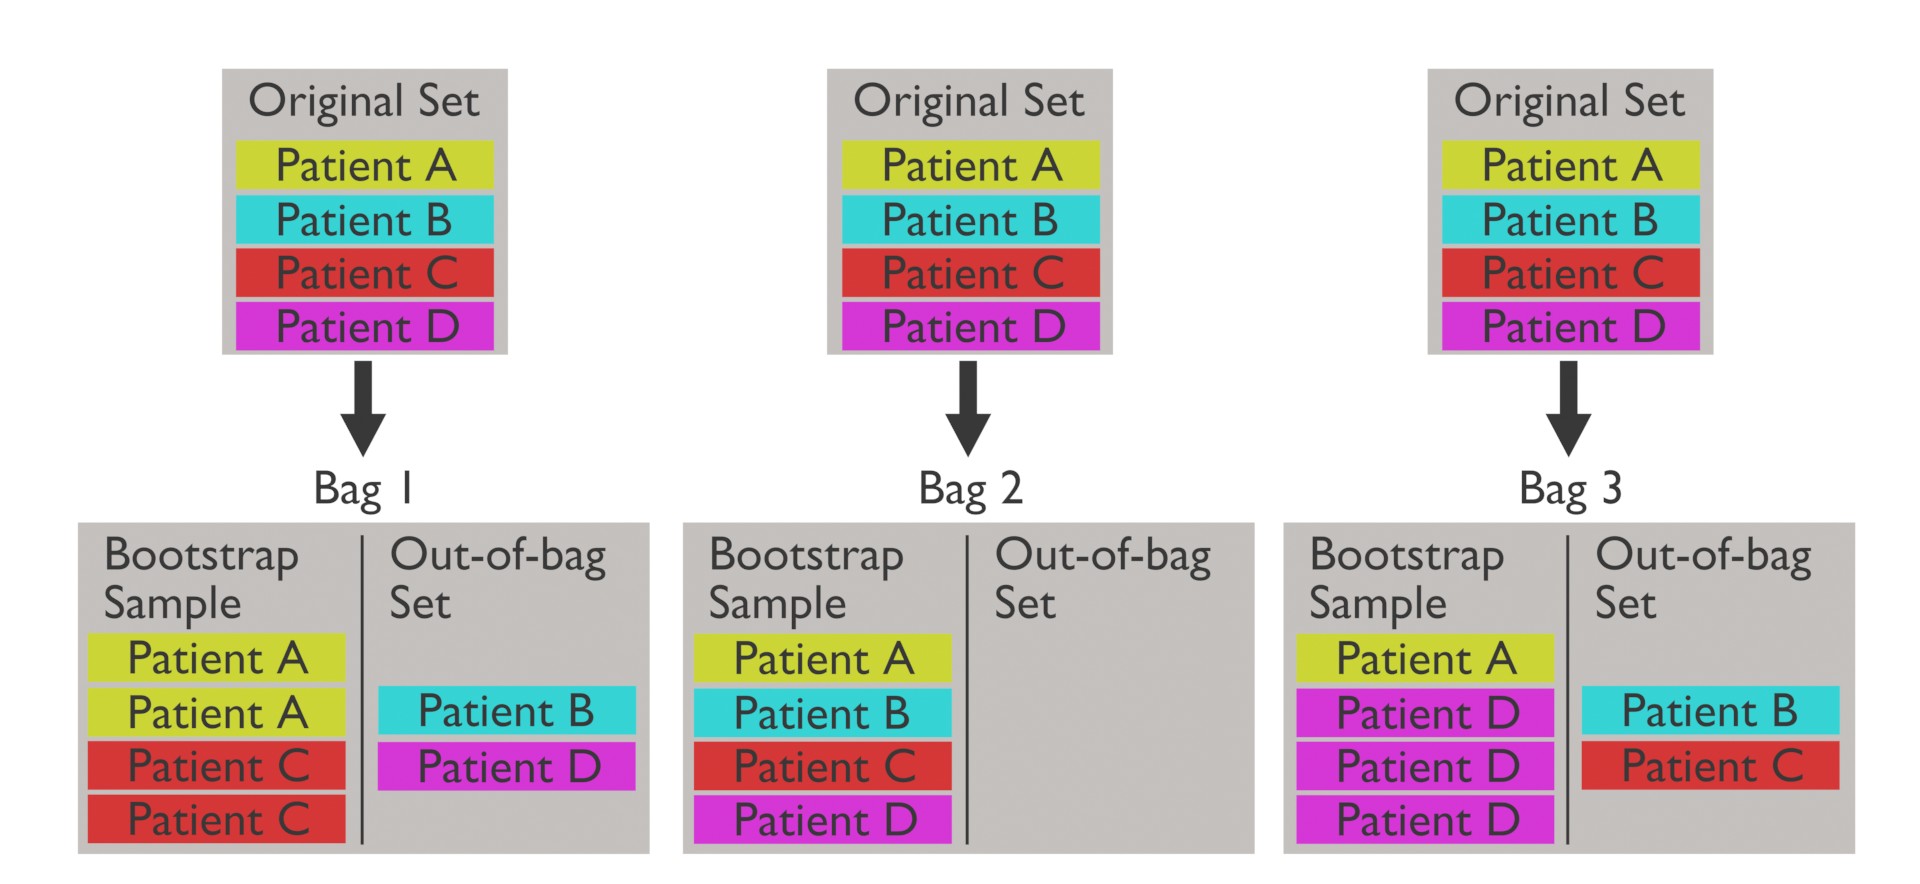
- Training data is split in bag and out-of-bag for validation
- The Out-Of-Bag-Error is the Out-of-Sample Error of the tree trained with the respective bag
https://upload.wikimedia.org/wikipedia/commons/3/36/Sampling_with_replacement_and_out-of-bag_dataset_-_medical_context.jpg
 Boosting
- with bagging, we randomly draw the bags
- with boosting, we take into account the previous classifiers’ success
- Data that was miss-classified before is emphasized
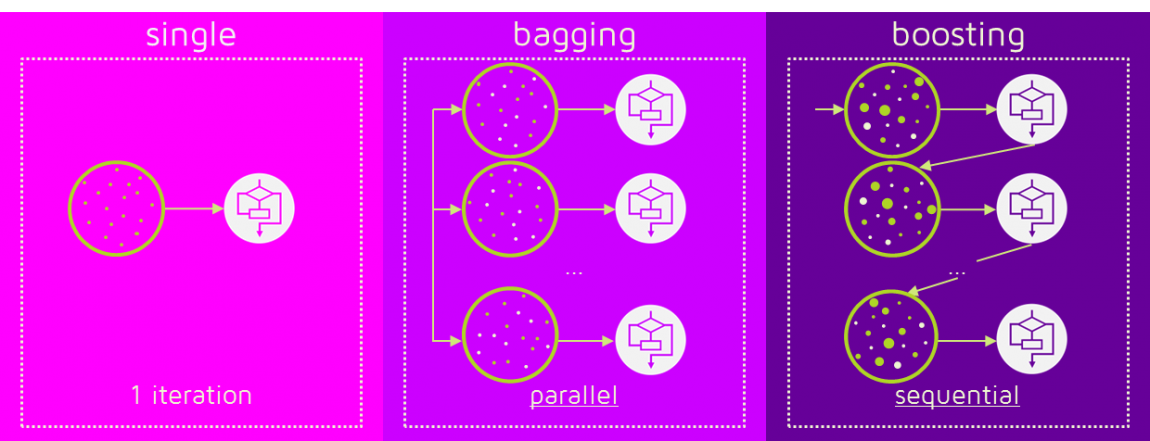
https://quantdare.com/what-is-the-difference-between-bagging-and-boosting/
 Prediction
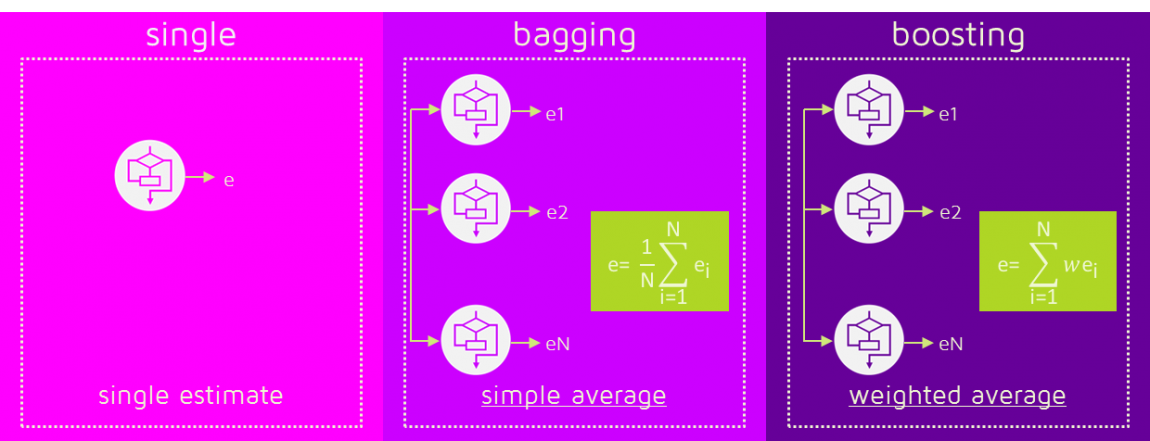
https://quantdare.com/what-is-the-difference-between-bagging-and-boosting/
 Random Forrest (Bagging)
- are a bagging approach to trees
- different trees are trained on different data
- the classification is based on the majority vote
- they also include feature bagging
 Variable importance
- parametric models (e.g. linear regression), have coefficients we can interpret
- non-parametric models (e.g.
- random forests are non-parametric models, but it is possible to calculate the feature importance:
- to measure the importance of the
- the out-of-bag error is again computed on the original and the perturbed data set
- features with a large negative effect are ranked as more important
- to measure the importance of the
 eXtreme Gradient Boosting (Boosting)

- open source implementation of gradient boosting based on trees
- usually outperforms a random forest and is a good benchmark for other models
